One scalar, many processes
A pass rate is a thin read-out. It ranks systems but cannot say whether a model reached a productive region, avoided a failure trap, or recovered after entering one.
Fudan University · arXiv:2605.31308
TraceGraph — pooling many models' runs into one shared decision landscape of Access, Trap, and Repair
A pass rate ranks. A landscape explains.
The one idea
Agent benchmarks now record rich interaction traces — interleaved thoughts, tool calls, and environment feedback — yet evaluation still collapses each rollout to a single number: pass / fail, reward, leaderboard average. Three agents can finish within three points of each other and have travelled completely different routes: one explores broadly and repairs its mistakes, one stays shallow and avoids risk, one reaches far but keeps falling into traps. TraceGraph recovers those routes by placing many models' trajectories onto one shared map.
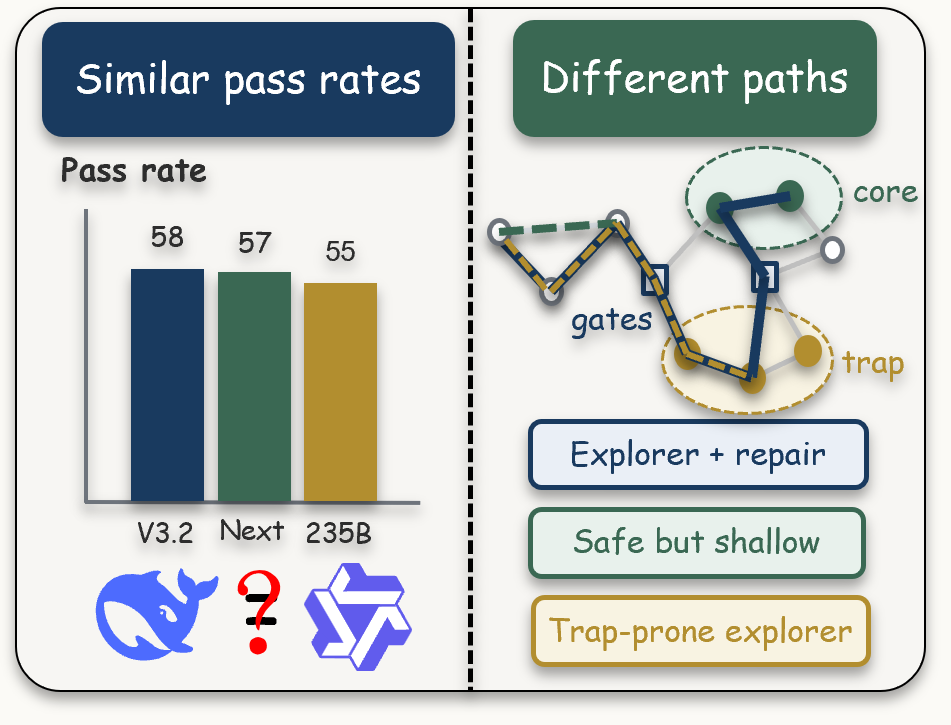
A pass rate is a thin read-out. It ranks systems but cannot say whether a model reached a productive region, avoided a failure trap, or recovered after entering one.
Align trajectories by observable action–observation states and they stop being arbitrary traces — they form recurring traffic patterns over the same task-specific terrain.
Read each rollout as Access, Trap exposure, and Repair. Then ask the two questions a score can't: what process does each model supply, and what process does each benchmark demand?
How TraceGraph works
The order matters: TraceGraph builds one landscape per task from pooled rollouts, and only then overlays outcomes and compares models. Graph construction defines the terrain; model and benchmark analyses are overlays on it. Model identity is never part of the signature, the distance, or the graph.
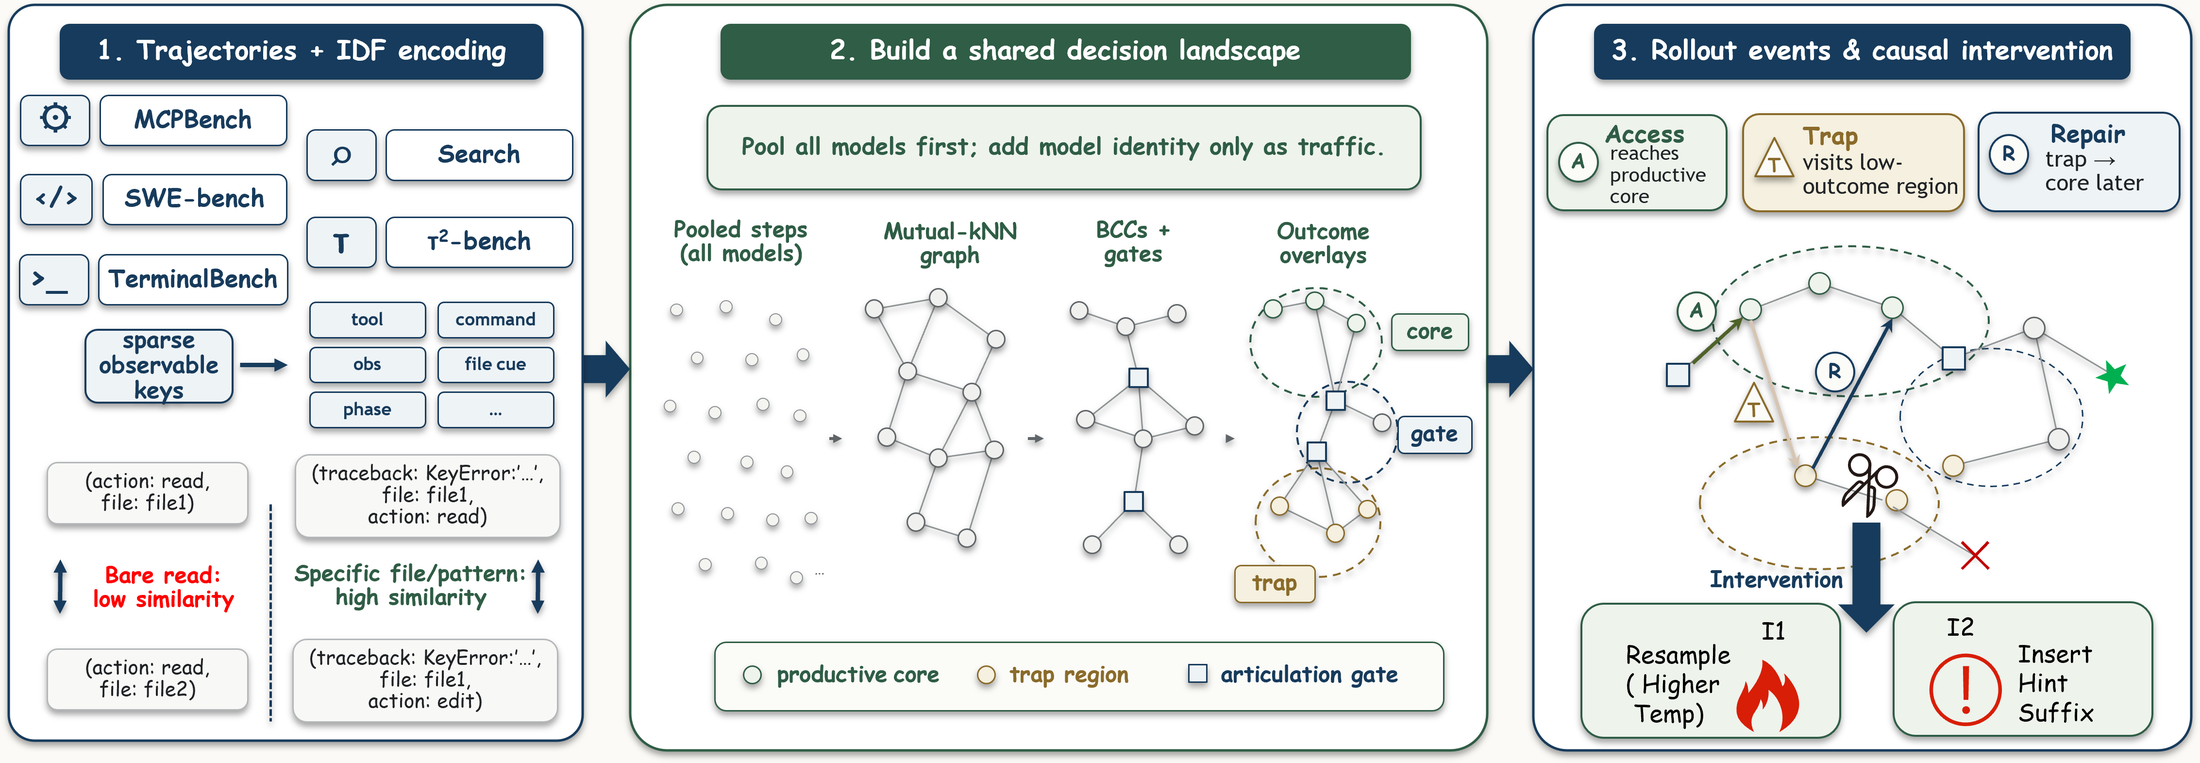
Each action–observation step becomes a sparse set of keys — tool and action type, command class, observation pattern, file cue, temporal phase. Similarity is IDF-weighted Jaccard overlap, so a rare traceback at a specific file weighs more than a bare “read”.
Mutual-kNN edges over all pooled steps form one task graph, decomposed into biconnected components (shared states) and the articulation points between them — the gates where a run can branch into qualitatively different continuations. 82 of 100 graph-found gates match a human-judged strategy or phase change.
Diffuse each block's centered reward over the graph; the high-positive quantile is a core, the low-negative a trap. Then every rollout reads as three bits — Access (reaches a core), Trap exposure (enters a trap), Repair (visits a trap, later reaches a core).
The overlays are descriptive, not predictive: they locate where high- and low-outcome traffic concentrates, not whether an unseen run will pass. A trap is a low-outcome region — not a label for “bad action”. TraceGraph is a measurement scaffold, not a score.
Supply & demand
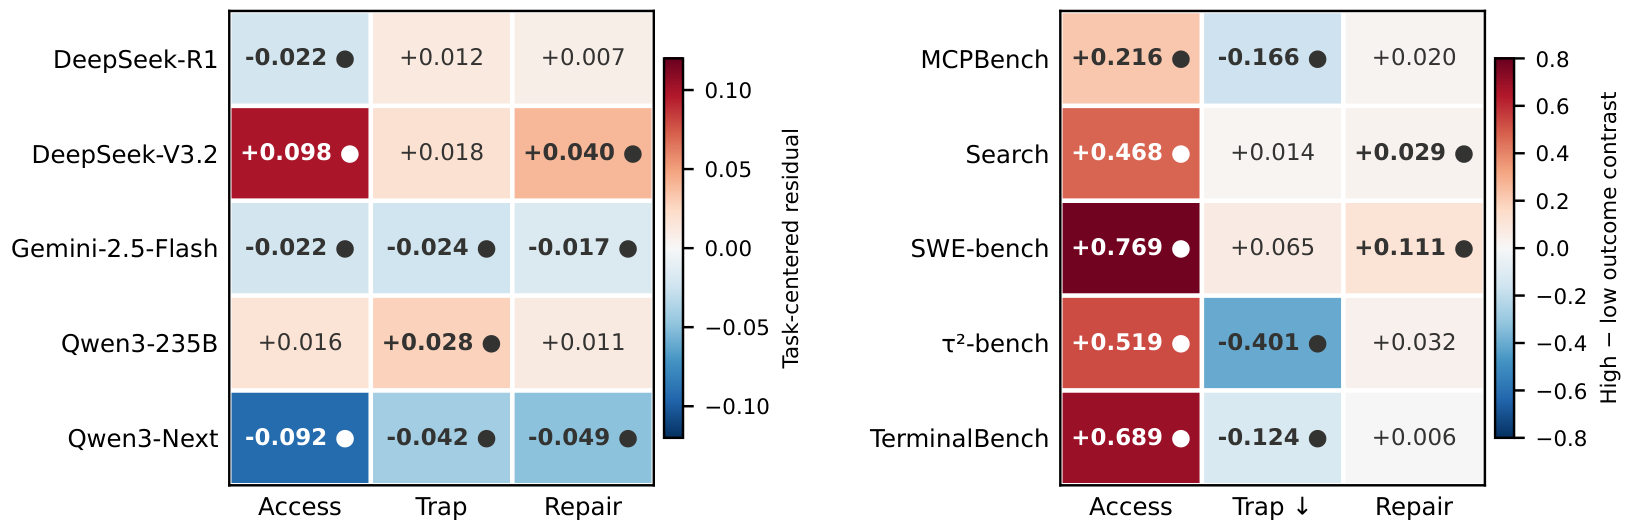
Once the landscape is fixed, model identity is just traffic over the same terrain. Two compact profiles fall out: a model's supply (how often it shows each event, relative to peers on the same tasks) and a benchmark's demand (how much each event separates winning from losing traffic).
DeepSeek-V3.2 is the clearest high-Access, high-Repair navigator; Qwen3-Next is low on both — conservative and shallow rather than robustly recovering. Others sit between. Same scores, different process signatures.
Access is universally positive, but the diagnostic axes split: τ²-bench is strongly trap-averse (−0.401), while SWE-bench uniquely rewards Repair (+0.111). Avoiding traps and recovering from them are different design targets.
Benchmark difficulty isn't one hidden factor — it's a mixture of exploration, avoidance, and recovery demands. The supply–demand profiles say which mixture each benchmark tests, and which models match it.
The map pays off
If traps are repeatable trajectory states, they should flag moments where a small recovery policy can help. Because SWE-bench has the clearest positive Repair demand, TraceGraph turns its trap overlay into a live detector: when a rollout enters a historical failure region, fork the same prefix and try a lightweight continuation — no oracle, no gold patch.
On trap-triggered states across the 500-instance SWE-bench Verified pool, the best pooled single-factor policy lifts official resolved rate from 40.4 → 43.5% (+3.1 pt, p=0.016) per provider and 41.0 → 44.8% (+3.8 pt, p=0.045) on common-fired instances — with the active lever differing by provider.
The detector stores canonicalized key sets from trap-side states and fires only when a live SWE-bench step matches a failure region and carries a local file cue on an edit/submit action. On firing, it snapshots the workspace and resumes the identical prefix under a temperature bump (Hot) or a conservative, log-only diagnosis Note.
Across three fresh providers (Qwen3.6-35B-A3B, GLM-5.1, DeepSeek-V4-Pro), pooled recovery beats baseline at fired states. The route differs: Qwen3.6 benefits most from the diagnosis note (+4.7 pt), while GLM-5.1 and DeepSeek-V4 gain most from the temperature bump (+4.6 / +3.4 pt) — per-provider deltas on small fired subsets, less powered than the pooled result above.
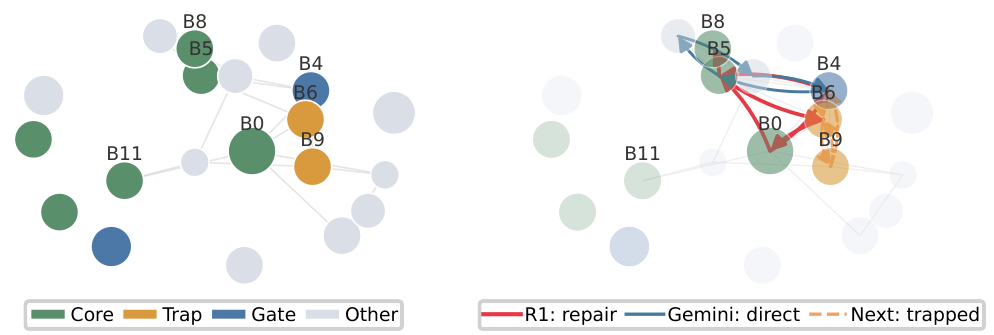
django-9296). (left) The block graph — green cores, amber traps, blue gates. (right) R1 repairs from a trap back to a core; Gemini navigates directly; Qwen3-Next cycles in a trap without escaping — exactly the differences a scalar score erases.The roles are outcome-informed by design, so TraceGraph explains where high- and low-outcome traffic concentrates — it is not a blind success predictor. A trap marks a low-outcome region, not useless behaviour: 36% of trap blocks are judged exploration. The recovery gains are local downstream improvements on a structurally-selected SWE-bench subset, not a universal repair result.
Built from 5 benchmark splits · 427 tasks · 16.1 blocks / task MCPBench · Search · SWE-bench · τ²-bench · TerminalBench — gated cx-cmu trajectory release · observational models: DeepSeek-R1, DeepSeek-V3.2, Gemini-2.5-Flash, Qwen3-235B, Qwen3-Next
Watch
Cite
@misc{nian2026tracegraph,
  title   = {TraceGraph: Shared Decision Landscapes for Diagnosing
             and Improving Agent Trajectories},
  author  = {Nian, Junjie and Chen, Kang and Zhang, Ge and
             Cao, Yixin and Jiang, Yugang},
  year    = {2026},
  eprint  = {2605.31308},
  archivePrefix = {arXiv},
  primaryClass = {cs.CL},
  note    = {TraceGraph},
  url     = {https://arxiv.org/abs/2605.31308},
}
Access · Trap · Repair — the process a benchmark really tests.