One scalar hides the process
A majority vote ranks answers but says nothing about whether two correct runs reached it through the same computation or through separate routes that merely agree at the end.
Fudan University · Shanghai Innovation Institute · arXiv:2605.14619
SliceGraph — an activation-key atlas of many CoT runs, where same-answer correct trajectories split into distinct process routes we call isomers
One answer. Many minds.
The one idea
Test-time sampling now draws many chains of thought per problem, and self-consistency keeps only the majority string. But the N runs of one problem are not a bag of independent samples: they share intermediate computation, fork at decision points, and rejoin through common subroutines. Once internal states are linked by similarity, consistency can be lifted from final answers to processes — and the question becomes whether correct solutions converge on one route or split into several.
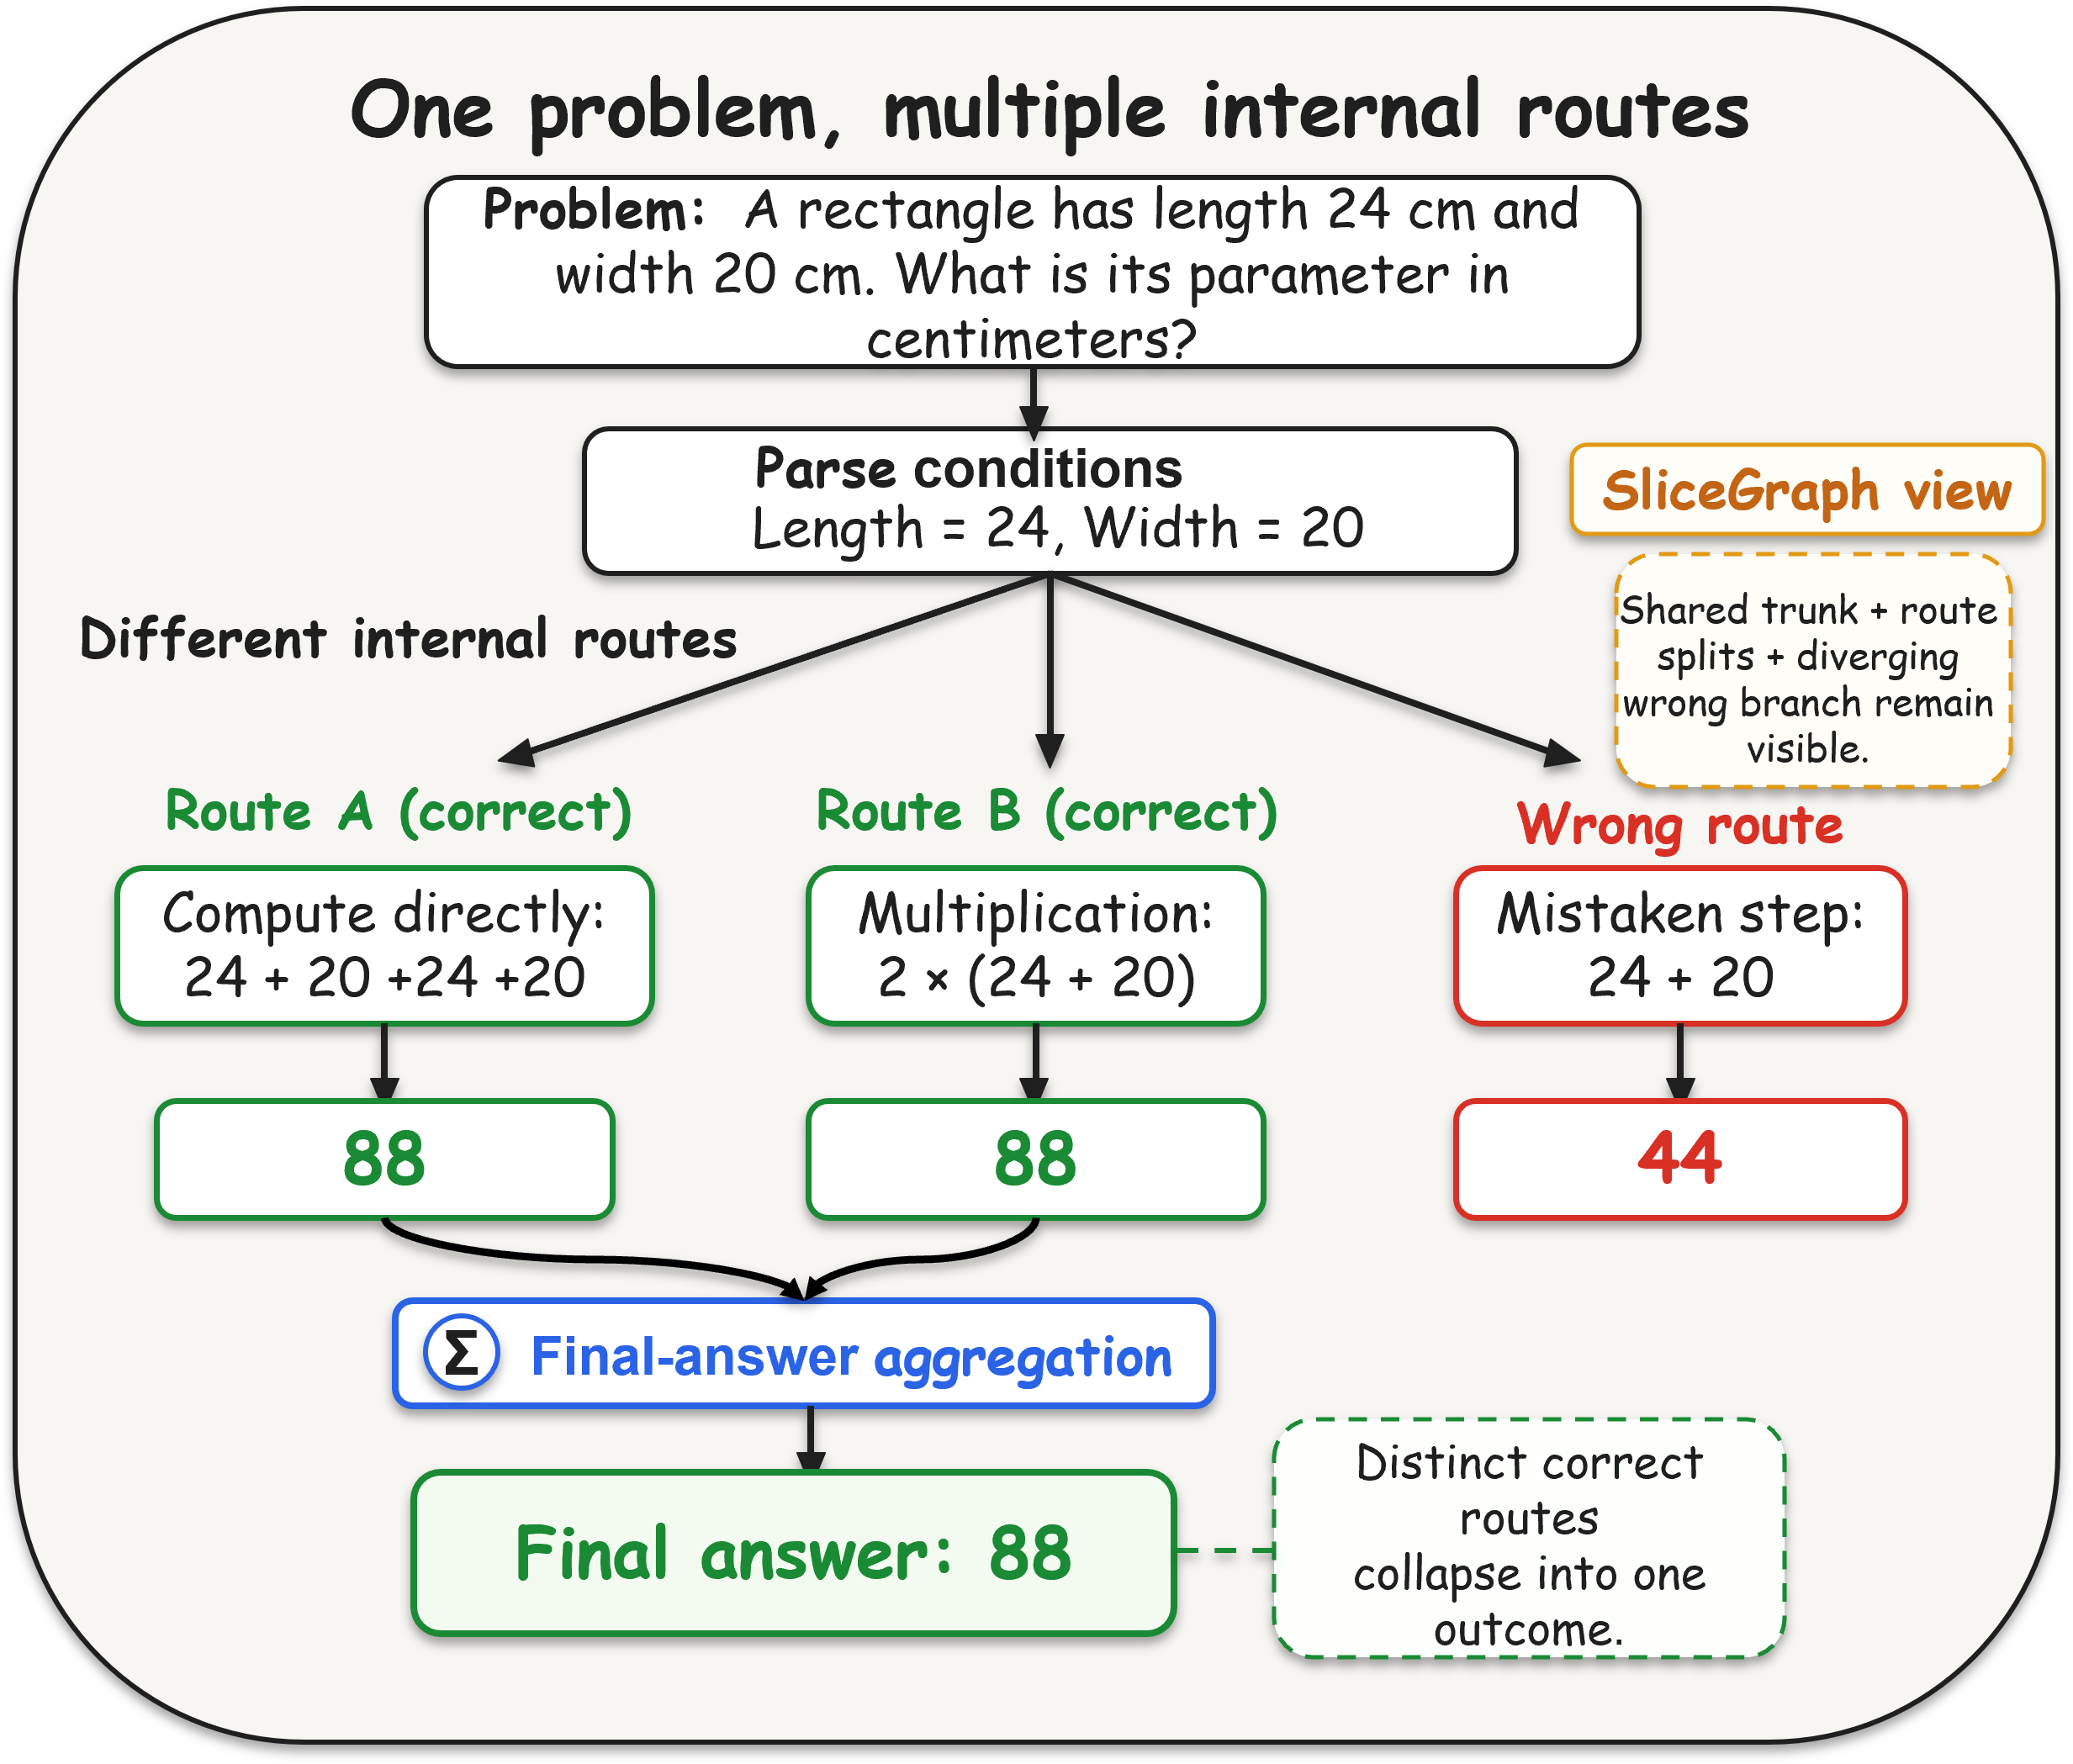
A majority vote ranks answers but says nothing about whether two correct runs reached it through the same computation or through separate routes that merely agree at the end.
Whole-run similarity is too coarse: two runs can share a long trunk and fork once, or reach the same answer by different routes. SliceGraph compares 256-token slices instead.
Two correct runs are process isomers when they reach the same normalized answer but belong to different route families — same destination, different scaffold.
How SliceGraph works
SliceGraph is a measurement object, not a decoding program. It is built after sampling, directly from sparse neuron-activation keys — no projection, no text embedding — and every structural unit is validated by blinded human annotation before any geometric claim is made.
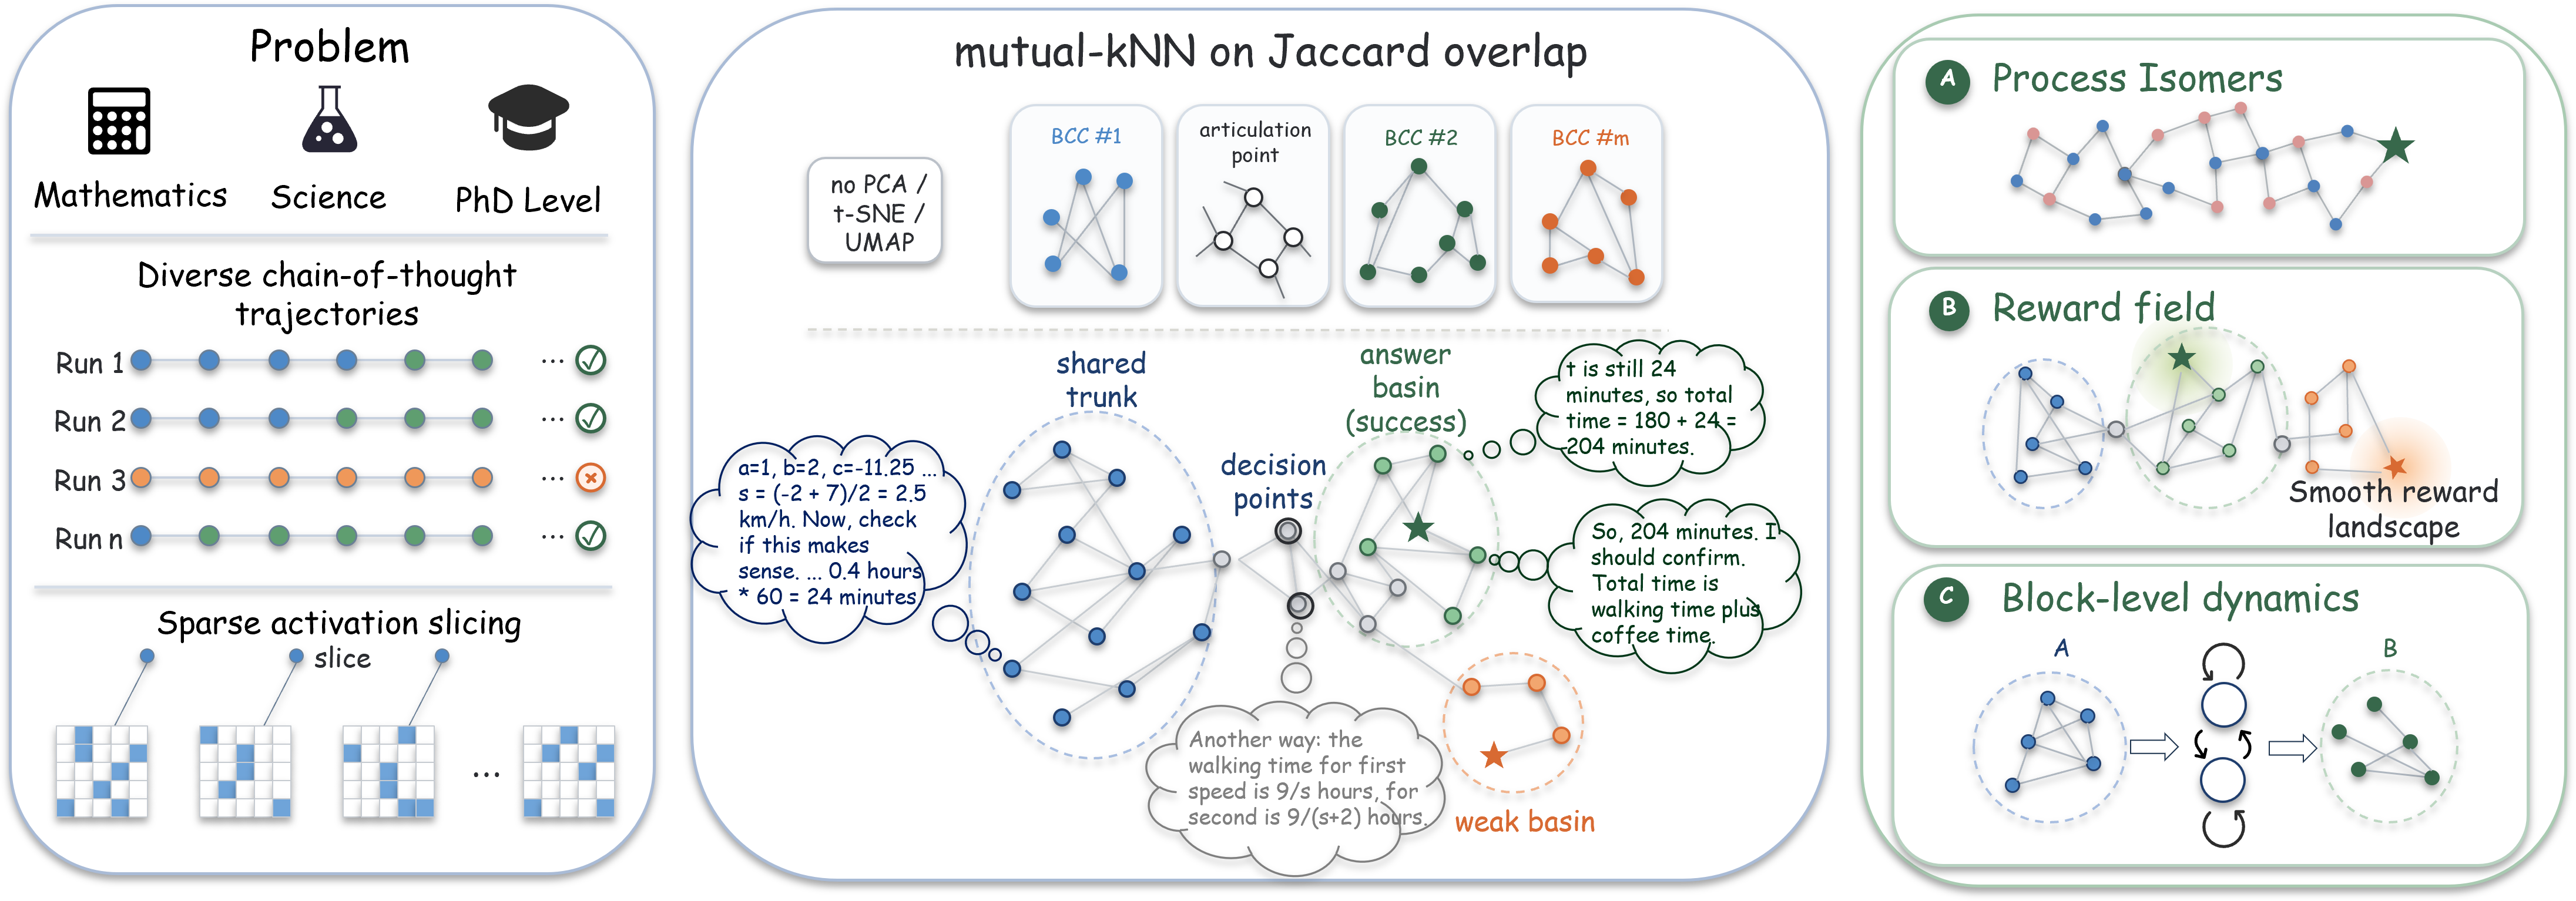
Each 256-token slice is a binary set of the most-active MLP neuron keys — no magnitudes, no projection. Two slices connect by Jaccard overlap, kept only when the neighbourhood is mutual (mutual-kNN). The result is one per-problem graph of cross-run local similarity.
Biconnected components are shared reasoning-state units; articulation points are the forks where the run population branches. Each non-trivial block gets one of five roles — trunk, answer basin, weak basin, decision point, intermediate.
Reduce each correct run to the blocks it visits, weight rare blocks up, and partition by Louvain. Same-answer runs in different families are process isomers. A label-seeded reward field and typed-state kernels are separate overlays — never used to define families.
The graph, its blocks, and the family partition never see answer labels or the reward field. The route scaffold is answer-free; correctness and value enter only as interpretive overlays on a structure validated in its own right.
Is the atlas real?
Before any isomer claim, two questions: do the graph's units match human notions of shared thinking, and does the activation-key scaffold preserve process geometry rather than inventing it? Two blinded annotation studies and a representation ablation answer both.
On blinded pairs, annotators recover the same-BCC / across-BCC split at 88.9% and 90.3% (κ = 0.97); within-family pairs are judged same-strategy in 94.4% of decisive cases — the units are semantic, not artefacts.
Under a fixed mutual-kNN framework, unprojected activation-key Jaccard keeps the richest, most stable family multiplicity. PCA-50 compresses ~1 family per cell; slice-text MiniLM collapses the atlas (21 / 954 valid cells).
With validated units and a preserved scaffold, the multi-route claim rests on structure, not on a projection artefact. The isomer statistics that follow are measured on this vetted atlas.
What the atlas shows
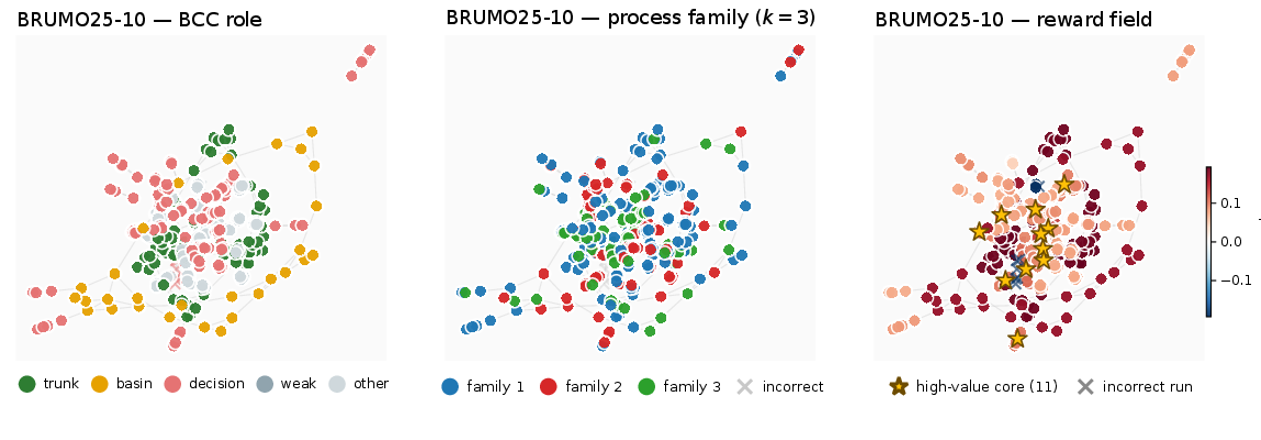
On 954 problem-model cells — 318 problems, three primary 4B/8B models, 64 runs each, on AIME24/25, BRUMO25, HMMT25, and GPQA — same-answer correct CoTs routinely split into multiple process families, and the value landscape splits with them.
In 85.5% of 954 cells, correct CoTs sharing the same normalized answer split into multiple process families; the average pairwise isomer rate is 76.6% (problem-clustered bootstrap 95% CI 75.6–77.5). Split-half resampling keeps both halves multi-family in 97.2% of cells, and a held-out atlas retains 91% — SliceGraph recovers multi-route structure when present rather than forcing it.
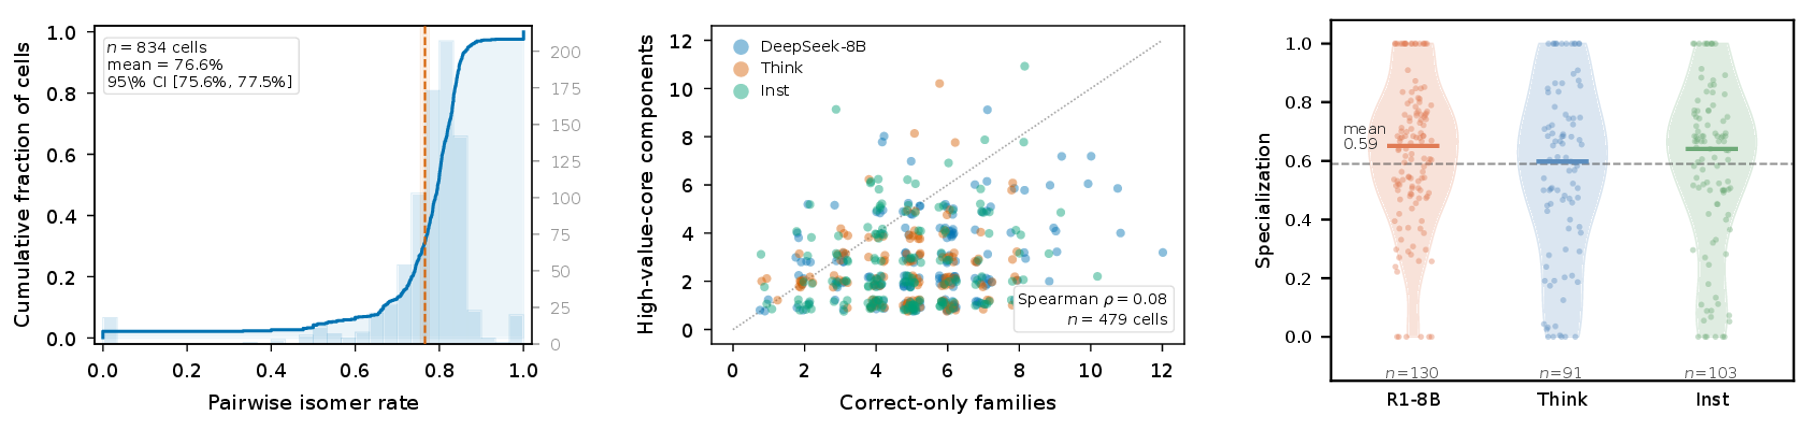
A label-seeded reward field, diffused over the fixed graph, splits into disjoint high-value cores in 67.6% of reward-evaluable cells. Route families specialize over those cores (specialization 0.59) and are individually coverage-critical — value refines the route map without redefining it.
Lifting each run to a typed-state transition model, between-family total variation exceeds a size-preserving label-shuffle null in 80.9% of cells (median z = 3.14). Restricting to shared states keeps 77.4% — families differ not just in where they concentrate but in how they move.
SliceGraph is a post-hoc measurement object: the reward field is descriptive (label permutations stress-test that layer, not one-sided nulls), and claims are scoped to non-code math and science. It audits route diversity, collapse, and over-concentration — using it inside decoding or early-stopping is left for future work.
Built from 954 problem-model cells · 318 problems · 6 models R1-8B · Qwen3-4B Think / Inst (primary) · Llama-8B · Qwen3-32B · Qwen2.5-Math-72B (replications) · AIME24 · AIME25 · BRUMO25 · HMMT25 · GPQA · κ=0.97 & 94.4% blinded validation
Watch
Cite
@misc{chen2026slicegraph,
  title   = {SliceGraph: Mapping Process Isomers in
             Multi-Run Chain-of-Thought Reasoning},
  author  = {Chen, Kang and Nian, Junjie and Cao, Yixin and Jiang, Yugang},
  year    = {2026},
  eprint  = {2605.14619},
  archivePrefix = {arXiv},
  primaryClass = {cs.AI},
  note    = {SliceGraph — a process atlas for multi-run CoT},
  url     = {https://arxiv.org/abs/2605.14619},
}
Same answer. Different minds — a process atlas, not a decoder.